

KEY BENEFITS
Better visibility, better IT decisions
When service data is live and visual, decisions move from gut feel to evidence.
One source of truth
Unify incidents, requests, changes, and problems into a single governed model everyone trusts.
Act before SLAs slip
Spot backlog build-up and breach risk early, then rebalances queues before customers notice.
Invest where it matters
See which services categories and teams drive demand to justify headcount and tooling spend.
Prove IT's value
Share executive-ready reports that tie service performance to business outcomes.
METRICS
The metrics your service desk runs on
Pre-built reports for the questions IT leaders ask every week.
Ticket trends
Volume by category, channel and priority over time. Forecast seasonal peaks and recurring issues.
SLA compliance
Track met, at-risk and breached SLAs by service, team, and customer tier in real time.
Response and resolution times
First response, MTTA and MTTR with drill-downs to find the bottlenecks behind the averages.
Team workloads
Tickets per agent, reassignment rates and backlog age to keep teams balanced and healthy.
ANALYTICS
See your whole service operation at a glance
An example of the IT operations that ship with the integration, fully editable in Power BI.

View your stats with models
You can view the data relationship in the Model view to visualize and manage the connections between tables and more in Power BI.
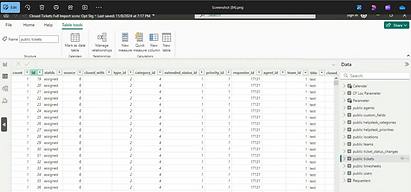
Seamless connection
Easily connect databases from BOSSDesk® to enable analysis and visualization of support tickets, workflows, and other metrics.
Experience data visualization with Power BI in BOSSDesk®
Make Data-Driven Decisions With Power BI
Integrating Microsoft Power BI with your IT ticketing system gives you deeper insights into ticket trends, team performance, and service delivery.
Transform BOSSDesk data into interactive dashboards and custom reports to identify bottlenecks, monitor key metrics, and make informed decisions that improve IT efficiency.
See how BOSSDesk and Power BI can help you optimize IT operations!
HOW THE INTEGRATION WORKS
Live in an afternoon, not a quarter
Three steps from a service desk to shared dashboards.
01
Install
Download Power BI and run the downloaded installer and follow the on-screen instructions to complete the installation.
02
Connect
Enter your BOSSDesk names and choose a data connectivity mode. Select the desired data tables, and load to import the data into Power BI for analysis and visualization.
03
Create
In Power BI’s Model view, review existing table relationships or create new ones by dragging and dropping connecting fields between tables.